Winter Weather Advisory

Never Simple

>> Saturday, January 31, 2015

I sat at work yesterday touting that for once we would have a storm that wouldn't play games.  It wasn't going to ride the coast with an indeterminable track.  This would come from the west.  It would move through with the same energy it had coming from the mid-west.  If they get 8-12 inches of snow draw a line east and that area will get the same.  But this is the east coast.  It can't be that easy.

Winter Storm watches have been posted for Berks and the Valley.  As of right now that is the cut off line as counties to the south and east have nothing.  That will eventually change but also shows just how tight this could become in determining who gets what.  The good news is, and trust me this is good news, right now we are in the snow portion of the storm where as Philadelphia is not.  Damn you warm air.  To the maps we go.


We start with the GFS. The often unreliable yet somehow mildy accurate model.  Maybe that recent upgrade has worked.


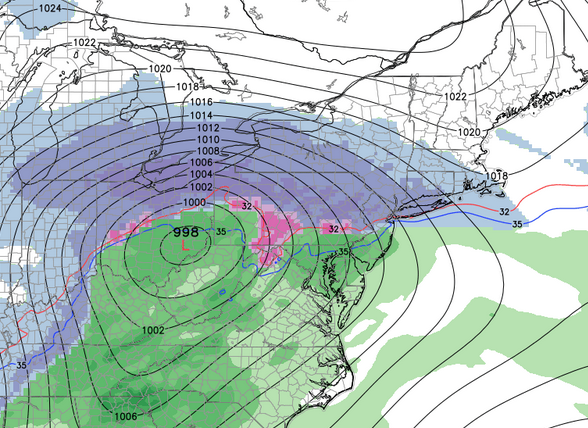
GFS wants a battle.  You can clearly see the 32 degree line with heavy snow to the north and rain to the south.  Notice there is very little mixing.  I feel this has to do with just how different these temperature variations are as warm air is pulled north.  In our area that line is cutting through southern Berks at the onset.  Of course this will change.


Here is the next image that clearly shows the low moving across the Mason Dixon line.  Everybody is now in the heavy rain portion of the storm with temperatures between 32 and 35.  The storm after this would track off the coast and once again give heavy snow to New England pulling down the cold air on the back end and finishing as snow for our region.


For the totals:


Berks:  3-5
Allentown:  6-10
Philadelphia: Coating-2


The Canadian model that tends to be similar to the GFS doesn't buy into the same idea.


The Euro doesn't either.  Their snowfall maps look similar to the one above except scaled back a bit.  Totals for all of our region would fall in the 8-14 inch range.


Here is the current snow total map from NOAA.


AccuWeather is buying the GFS.


The Weather Channel is not.  Props for throwing in Allentown.  I better watch myself before I start falling for these guys again.


The North American short term was updating when I started this and have since adjusted totals a bit.  And they shifted to the south.


In a sense we have somewhat of a reversal from the last storm.  The Euro was the only major model to hang on to a significant snowfall in the interior while the GFS called for the push east.  This time the GFS is the only one to push this storm to the north while others keep cold air hanging further south.  It would be an easy decision if other outlets did not agree with the GFS, but it is clear AccuWeather shows some agreement.

Here is what we do know.  In almost anyway you slice it we are too close to the boundary between heavy snow and light snow to fully understand what will happen.  In a case of another change from the last storm where NOAA had totals I completely disagreed with I think their current map above is very accurate for right now.  I do think the GFS is too far north with the rain line however I don't think we can stay all snow right now.  The heaviest is just to our north running across the PA-NY border through CT and MA.

Since this will probably be the last time I post all these maps even though I'm sure there will be adjustments, I will use this as a basis going forward.  Which means I need to throw my hat in the ring.

Reading:  6.9 (They won't report)
Allentown: 8.6
Easton/Town close by:  9.4
House on top of 1,000 foot mountain in NJ:  12+

I am looking forward to this one regardless of totals.  Got to keep those snow totals climbing.

Currently after the random squalls yesterday:

Allentown = 19.1 inches   

Read more...

Dowery Follow-Up

>> Friday, January 30, 2015

There is an interesting scale that was created by a couple dudes from the National Weather Service that places storms in a certain category based off snowfall totals and population affected.  The only one I know of is designed for the northeast most likely because of the intensity of the storms and the amount of people in the region.  I've talked about this ranking before.  You can read more about it and all the guidelines if you care at NESIS.

I bring this up because I brought up yesterday that as much as I wanted to ride with the hype over the last storm it just didn't have what it takes to be considered one of those classic storms.  Well the guys at NESIS have already placed the storm into the rankings.  With that said you at least know it made the chart which dates back to storms from the late 1950's.  There are only 55 storms that have been placed in a category as of right now.

Here is the category and value system.  Again if you want details you have to read into it.


It sort of plays out in the same manner as a tornado or hurricane scale.

So where did this mighty storm that dropped three feet of snow in some areas fall on the list?


A big old 2.  Or in other words of the 54 storms already on the list this one fell into 41st. 

In case you are wondering only two have been classified as a category 5.  One was in January of 1996.  The other was the monster March 1993 storm.

Now that we can all calm down let's move on to the next system arriving Sunday night. 


Read more...

Winter Storm Dowery

>> Thursday, January 29, 2015

This is the actual real one.

  • Date:  January 25, 26, 27
  • Impact Areas: Northeast
  • Peak Winds: +70 MPH
  • Snowfall:  Multiple Reports of  +30 inch totals - Highest reported of 36 inches in Massachusetts 
  • Notables:  Boston - 24.6, Portland - 27.4, Central Park 9.8 


I really wanted to lead off with how insane this storm was and that it was all you could want in a storm.  The problem is I can't.  It will go down in the record books without doubt.  In keeping with hurricane tradition I will also retire this name though I can't see myself reusing names anyway.  For record keeping in case I continue this for awhile I will make note of the date and name.  Thinking back on storms of the past keeps this off the upper echelon.

For starters the area affected turned out to be quite small.  Had this been a classic I-95 storm with huge impacts from D.C. to Boston I think we'd be talking about something different today.  That didn't happen although the initial call was for far worse.  I saw a lot of apologies coming out from various sources including the NOAA for being so horribly incorrect.  It's nice for them to do however I mentioned before that this is such a guessing game that you can't begin to understand what type of challenge these storms are to predict.

I'm far more annoyed by the media who almost all become completely unwatchable.  It's the ultimate in watching who can get the most viewership by spouting off incorrect information to make things seem far worse than they actually are.

Blizzapocalypsegeddon '15 - The White-Erdammerung!:

The Daily Show has often made fun of these shows.  If you get a minute take a look at their last piece.  It sums up a lot of my issues.  Even I didn't watch any live reporting from New England.  The problem is that while these stupid reports are being made about what became a snowfall in New York there were far more serious issues.  Just like any coastline that can be wonderful to live near most of the time, there are risks.  Everybody in New England knows.  Nor'easters are virtually a winter hurricane.  It has all the same type of qualities.  And for people near the coast it produces flooding.  Flooding and freezing temperatures don't mix well.  Do a search on coastal areas of Massachusetts or Nantucket and see what happens.  It's not pretty.  People lost houses.   


I'm still more amazed at how these things form.  I tried finding some satellite or radar images of what went from nothing to a huge storm in the matter of a day but nothing really caught my attention. 

This relatively light snow that is cutting across the northeast tonight will also quickly strengthen.  The impacts are less great since it will be generally in Maine and probably not mentioned much.  But just take a look at the snowfall prediction.  The highest total for this little piece of energy is 17 inches.  All because it develops and strengthens off the coast.


Read more...

Historic Storm - Massive Bust

>> Tuesday, January 27, 2015

There will not be a wrap up for this historic snowstorm tonight.  That's because it is still snowing heavily in New England.  At this point I wouldn't be too surprised to see a town or two hit 40 inches.  Instead of the recap we get to look at what went so horribly wrong in areas that were forecast to see over a foot of snow.

These things happen.  I've learned to deal with them and not throw a hissy fit when things don't pan out.  It also helped that I mentioned numerous times in my post from Sunday that I was not convinced the particular area I am in (Reading) was going to see much.  We didn't.  If I lived in certain areas of New Jersey I think I might have been disappointed.

There is no doubt that as the storm continued to take shape the predictions changed with it.  That's understandable and actually quite smart.  Since I can't sit at work and make posts I am going to look at this from the perspective of what was put out Sunday night when I did my extensive post featuring all the maps.  It also places those maps roughly 24 hours ahead of the storm.  In most cases this would be more than enough time.  Not in the case of winter coastal storms.

The original plan before everything fell apart was to figure out who did the best at predicting.  Kind of hard to do that now.  As the forecast goes for local areas from Allentown to Philadelphia to the Jersey coast we get an F.  Some totals were closer than others but when it comes down to it there were too many numbers that never even came close to come to fruition.  I can give out a couple of attaboys.

I gave them a mention and they stepped up again or at least more than anybody else.  The Weather Channel map is actually pretty darn good comparatively speaking.  Central Park picked up almost ten inches.  Considering most had them close to two feet I'd say TWC did well with the low figure at 12 inches.  They also kept Philadelphia on the lower end with 5-8.  They ended up with just 1.2.  So much for Atlantic City.  TWC nailed that one calling for just 1-3 inches while every other map has them in double digits.  They ended the storm with one inch.

My totals were off but my instinct was right.  Berks currently has no reports but I live here and I'd say nobody had more than two inches.  The highest reported total in the Lehigh Valley was 4.5 inches and that is on the northern fringe.  Allentown officially clocked in 1.9 inches.  Hunterdon hit a high total of 5.0.  No pat on the back for those calls.  It's the following that are taken right out of the Sunday post that deserve a slight head nod.

"I have yet to see any indication that this storms greatly impacts our area."

When talking about the Weather Channel map - " I find this map far more realistic."

I'm really not convinced the storm does a lot from Reading westward.  Most of the total snowfall I see coming for those areas is connected to the clipper and the energy transfer.  All the models show an influx of moisture coming in from the east that almost stop right at the Berks border to the counties of the west.  If we are that close to the western edge I only sense two things.  It's more likely the moisture never makes it that far as opposed to pushing even further west, and the snow that does fall will be the lightest of the whole system.
 
Fortunately for me my call where I live ended up being accurate.  Had I detailed more of the Allentown area it would not have been as I thought more moisture would work in.

The statement in bold is where we can begin.    I made this for two reasons as it can help explain a little bit about these systems.  For starters there was only one model pushing for the western track.  That model was the EURO.  It happens to have a great record for this type of thing.  There is no reason to not to trust this model.  It excels in longer ranging forecasts and picks up storms much quicker compared to its counterparts.  I think the weather community latched on to this expecting it to once again show it was the best model.  This time it wasn't.  I decided to favor the majority regardless of their poorer reputation.  In the end they all ended up being too far west.  The second reason I said this was because there was never a time (that I saw) when this storm showed that it was going to hit our area.  When I posted Saturday I mentioned a surprise.  That was the first time I saw the storm come out of nowhere and develop into a nor'easter.  The location it hit was from Long Island to points north and east.  It ended up being just about right.

We did indeed see most of our snow from the clipper.  We did end up being too far west.  The problem was so were a lot of other areas.  I can't comment on the storm much because I really couldn't watch it take shape.  I saw tons of headlines about what went wrong but didn't honestly read any.  I don't care that much.  This is what happens.  I don't need an explanation.  But I can offer my amateur conclusion from the little I could follow.  I thought it took awhile to develop.  It didn't seem organized until it was already north of a point it was thought to start bringing back moisture.  By that time when it strengthens and the intensity picks up it is already too far gone.  In many storms there is an area I will now call the snow hole zone layer.  Many areas expecting to see snow ended up stuck in this middle area that saw a swath of snow to the west in central PA and a rotating wall of snow that seemed bounded by the coast.

Have no fear.  Snow will return.  Do you also like cold temperatures?  Sure you do.


The first is the GFS for February 2nd.  The second image is the GFS for February 5th.  The EURO is on board for the first one.  And we should see a possible inch Thursday night into Friday.

For those keeping score here is the current standing total for 2014-15 = 18.7 inches

If you have been also thinking that we've been getting off easy this winter you are probably still trying to erase last winter.  Plus after this last miss maybe we are.  Either way we are currently 3 inches ahead of average with more to come.


Read more...

Mega Storm Update

>> Monday, January 26, 2015

6:30 MONDAY UPDATE

Nothing much in terms of changes in what I predicted.  Models have continued to shift and in a funny way shifted in the worst way possible for snow lovers in Reading.  The EURO which really pushed for heavy snow further inland shifted a bit to the east.  The GFS and NAM corrected more to the west.  In a sense all models met in the middle which happens to leave Berks and points west on the sidelines.  Even my totals might be too high for Berks.  All others I stick with.  Here's why.

This is how close.


Remember, anything in pink is double digits.  That is one hell of a cutoff across the interior.

Read more...

2015 Mega Storm

>> Sunday, January 25, 2015

Considering the magnitude of this storm I am going to quickly bypass the 7.9 inches of snow that fell Friday night into Saturday morning.  It actually didn't even qualify for a name based on my standards.  The next storm will qualify for two.

It's not often you get a storm like the one that is about to happen Monday into Tuesday.  Somebody is going to hit 30 inches.  That for me in a coastal storm is the ultimate number to classify this as a monster storm that will go down in the books.

Now we play the game.  The clipper system is going to bring snow.  So nobody is escaping this one without getting anything.  Then the storm develops off the coast and kicks back very heavy moisture.  There is plenty of cold air in place which means very heavy snow for the coastal areas from New Jersey to Maine.  Where and when this storms forms and the direction it takes plays a huge role for our area.  Huge.

Since this type of storm is so rare I'm going to pepper this post with images from all sorts of sites along with giving my opinion.

I'll start out with this statement.  Whether it was two days ago, yesterday or today I have yet to see any indication that this storms greatly impacts our area.  By area I mean Reading.  I will touch base with the rest of the area locations later.  I think most of Berks is too far west to be in the main plume of moisture.

The current warnings as of 4:50 p.m.  These are subject to change as more info is processed.


Reading and Allentown - Winter Storm Watch

Philadelphia - Winter Storm Warning

New York City - Blizzard Warning


Map of Total Snow Accumulation according to NOAA


Aside from lake effect you will never see a map like this anywhere else but in the northeast.  You have a shade of 4-6 in far western Berks County to 24-36 inches in the New York metro area.

Reading in the 6-8
Allentown in the 8-10
Easton in the 10-14
Philadelphia in the 14-18

That maps seems a bit over done for me with the exception of the 6-8 inch totals.


Short Term Model Totals


This map shows the total snow through Wednesday.  Quite frankly it is not very impressive for us.  The max accumulation in blue is up to six inches with darker shades being more.  Purple starts six and above and pink begins double digits.  This again however is according to the short term forecast.  There are others.

From The Weather Channel


I take my jabs at The Weather Channel but I respect their winter weather team.  They also nailed the last snowfall so the credibility rises for me.  I find this map far more realistic.  Look at the one that NOAA put out and come back and look at this one.  Since it doesn't show up on the one above you will have to trust me that they have totals for New York City predicted at 24-36.  In fact pick just about any city and see the huge difference in totals between the maps.  One has Philly in 14-18 and the other 5-8.  AC shows up around the 14 inch total according to NOAA and 1-3 according to TWC.  The one thing we can do is come back and look to see just how close this ended up being.  My money is on the Weather Channel map being more accurate.

The EURO can't be posted but has stayed aggressive which is why I guess the weather service has kept such high total while others are keeping it lower perhaps using all the models to create an average.  I can give you the totals that this model shows before moving on to something that can be shown.

New York - 20 inches
Central and Northern NJ - 14 to 18
Philadelphia and Allentown - 10 to 14
Reading - 6 to 10

NBC Philadelphia Totals


Locals seem to be slow on putting out numbers.  Might be because it is a weekend.  Here is a look at what NBC posted although I have no idea when so this might change by tonight.


ABC New York


I often forget that New York maps cover a good chunk of our area as well.  This is a first for me.  I've never used a New York affiliate map before.  My only concern with the map is they leave a ton of wiggle room to be "right".  We give a pass when they show 12-24 inches yet that would be the same as putting up a graphic of 1-12 inches.


Canadian Model Totals


Resembles the short term model.  Not very aggressive until you move up the coast from Long Island and north.  I didn't mention it before but a few of these show more snow falling in Pittsburgh from the original clipper than what we would end up with.  Could be interesting to see if that happens.


AccuWeather


I was going to draw a map but I realize I'm well over an hour into this and it's time to move on to other things.  Instead I will give you my predictions by area.

Western Berks:  4-6 inches
Reading (area):  5-7 inches
Allentown (area):  6-9 inches
Hunterdon Co:  10-15 inches

This one is relatively simple in that the heaviest snow will fall to the east and especially northeast of a particular location.  I'm really not convinced the storm does a lot from Reading westward.  Most of the total snowfall I see coming for those areas is connected to the clipper and the energy transfer.  All the models show an influx of moisture coming in from the east that almost stop right at the Berks border to the counties of the west.  If we are that close to the western edge I only sense two things.  It's more likely the moisture never makes it that far as opposed to pushing even further west, and the snow that does fall will be the lightest of the whole system.

The fun part of this is that even if you look at the maps above (I will add to this later when other local news sites put out their maps) there is a varying opinion.  You can look at totals and see which models they based their prediction off of.  I'm in the boat that if one model which does happen to be accurate is predicting one thing and four others are predicting another, I'm leaning to the side of the majority.

One group who put out their map as I've been writing is EPAWA.  They favor the EURO.  They aren't the only ones especially looking at that NOAA map which will change five times before lunch tomorrow.


These guys are pretty good so check them out when you can.

Whatever happens, enjoy.  Snow is snow regardless of two inches or 22 inches.  One is a lot easier to shovel though.  Just don't be too disappointed if some totals are a bit lower than expected.

Read more...

Winter Storm Dowery Part 1

>> Saturday, January 24, 2015

Thanks NOAA for reading my post last night.  At least I assume they did.  I appreciate it.  Aside from waking up to seven inches of snow I noticed something else.


Hey look at that.  A winter storm warning for the Lehigh Valley.  I posted last night while it was snowing how I was slightly disturbed that only an advisory was posted.  I received an e-mail at 3:55 in the morning that a warning was now posted.  Little late for me.

Pictures will follow later.

And of course the snow for Sunday into Monday is back on the map with maybe a surprise.  Stay tuned for more.  Time to shovel.

Read more...

Late Start

>> Friday, January 23, 2015

The snow has already begun to fall in the next named nor'easter.  It's been a quiet January so far as snowstorms have been hard to come by while the cold air has been settled in.

By the time morning arrives most of this storm will have already moved past.  I'll take a good snowstorm but the majority of this one is going to take place during sleeping hours.  Like every storm before it and after it, everything will come down to how the storm tracks.  I've actually been surprised at the totals that are floating around out there on this one. 

Some have the area in 1-3.  Our official advisory is 3-5.  The Weather Channel has been consistently pushing 5-8.  Not only that but I'm a bit surprised that a winter storm watch hasn't been issued.  We had an advisory for the snow Wednesday and that was around an inch or two.  I know there are official protocols but after the debacle last weekend I would think there would be a push for something.  Advisory doesn't come across very well for me.  I follow the weather very closely and I had no idea that there was a chance for ice last Sunday.  Neither did a lot of other people out driving that morning.  The road crews didn't either.  All of a sudden that morning popped up freezing rain advisories.  Well when there are hundreds of accidents involving at times dozens of cars I think advisory goes out the window. 

Since maps at this time are relatively pointless the only thing I can do is take my randomly educated guess at what the final totals will be before a recap at a later unknown date.  Plus I still can't figure out where the newly improved GFS maps went to look at storms before they hit.  But I do have the short term and European.  Which by the way, the clipper on Sunday has consistently missed us to the south on the models so I'm not going to even touch that one at this point.

Allentown - 4.9 inches

Read more...

A Chill In The Air

>> Wednesday, January 7, 2015

I'm going to be honest, the last few weeks have been boring.  December ended up being 5 degrees above normal with less than an inch of snow.  It hit 63 on Christmas.  Forgive me for not posting about the lack of winter weather.

Now I'm sitting here at 9:30 with my outdoor temperature reading 9.5.  The snow from Tuesday still clearly visible with no plans of melting anytime soon.  Two cheers for the return of winter.  Now we can go back to the maps.

For the purpose of an update our official total (Allentown) is 7.9 inches for the season.  If it seems like a small number well it sort of is depending on what you consider small.  In historical context for our area it is actually right at average or slightly above for this time of year.  And that will be changing.  Let me remind you that this is the exact same week last year when six straight nights hit single digit lows and three fell below zero.  The high on this day last year was 8.  So let's consider this a warming trend. 

According to the GFS this is what we have coming up (subject to change at any time).

A big old mess on Tuesday.  Stay tuned.  The model never has our area in anything but orange which is the sleet, snow and ice mix.


This one shows a moderate snowfall on Thursday the 15th.


Both the GFS and Euro have snow totals in the 6-10 inch range through the 15th.  The Euro extends to the 22nd and predicts 12-18 inches over the next two weeks.  Once again we have some things to keep our eye on.

Read more...

  © Blogger template Webnolia by Ourblogtemplates.com 2009

Back to TOP